tutorials
Test image evidence from a paper
Overview
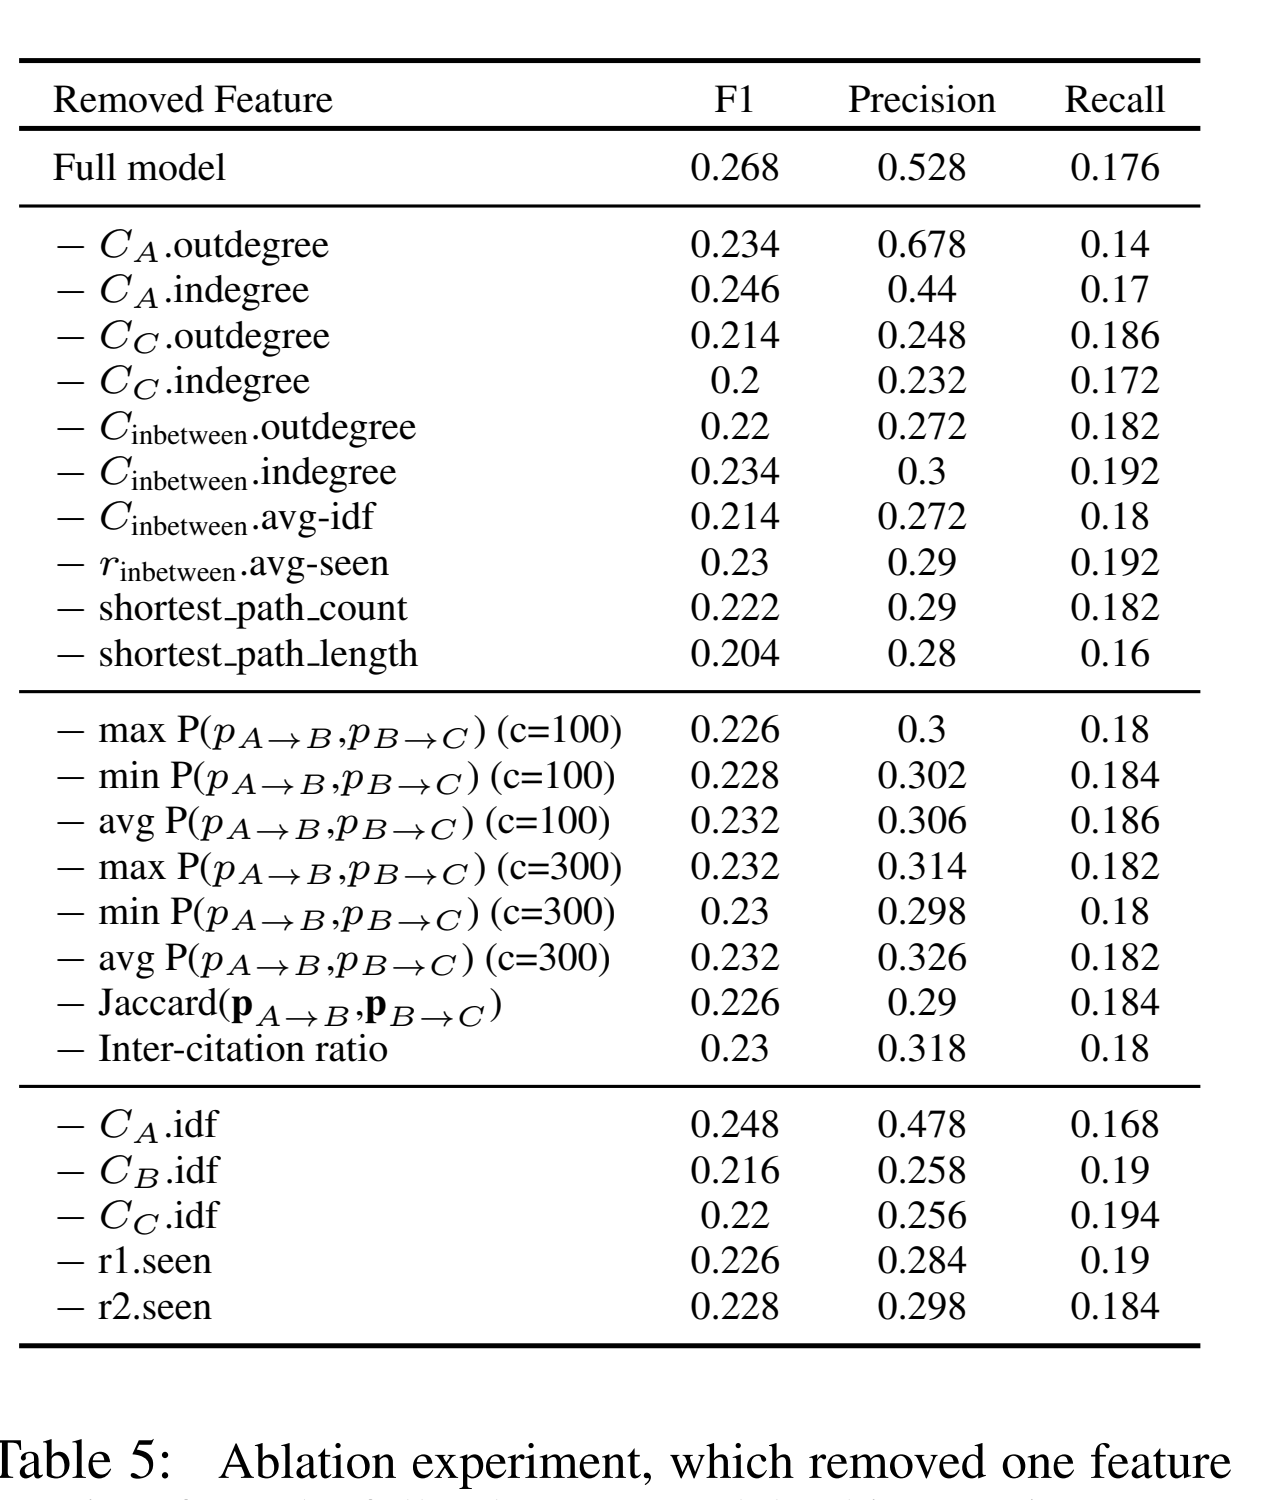
For the brave and curious, let’s go back to Table 5. Gemma called the right tool and got the right page, but read the F1 score as precision. Would a crop of the table help? This optional tutorial for Part 2 follows the tool calling tutorial. If you want to run the examples, use the same Paper MCP installation, imported paper, DOCUMENT_ID, and Model Gateway environment variables from that tutorial.
Outcomes
After working through the examples, you should be able to …
- explain what a crop can preserve when PDF text extraction loses the layout
- use grid cells to select and refine a crop from the original page
- send a local image and a question together in a Chat Completions request
- compare answers with and without a crop and check both against the paper
Work with a table or figure
Papers often contain figures and tables. When you read a table in a PDF, the position of a value tells you which row and column it belongs to. If you extract the PDF's text layer†, you may get the digits and labels without those relationships. The output can also include odd spacing, broken characters, or markup artifacts that the model may have little experience interpreting. If the authors supply the table as a separate data file, you can start with that instead.
One option is to convert the table to a more familiar format, such as simple HTML or Markdown (the current generation of LLMs loves markdown!). That gives the model explicit rows and columns. The conversion may require judgment, especially when headings span several columns or the extracted reading order is ambiguous. Even tidy looking conversions can put a number under the wrong header. While experimenting, check the cells you care about against the PDF.
Another option is to give the model an image crop of the table. The crop keeps the visual layout, while the extracted text can give the model another way to read the digits and labels. To try both, use separate labels such as Table crop and PDF text from the same page. Paper MCP's read_pdf_pages can supply the extracted text. For a figure, a crop plus its caption or the paragraph that discusses it may be a useful comparison. If you are checking a value on a plot, check the axis label and units as well.
For our Table 5 question, try comparing the extracted page with the same text plus an image crop. Keep the model and question fixed. When you check the answers, look for the same column error we saw earlier. 0.268 belongs to the Full model row, but it is the F1 score. The value under Precision is 0.528. The page grid example shows how to make a crop for this comparison.
Use a grid to locate a region
I tried this idea on a project for a customer in the construction industry. We were working with high resolution piping and instrumentation diagrams. These are drawings that show how equipment, pipes, and instruments connect. You might find one in a request for proposals (RFP) to expand a municipality’s water treatment plant. I suspect other people have had the same idea.
With a grid drawn over the whole diagram†, the model could identify a region using labels like B2 and B3†. We mapped those labels back to the original high resolution image and cropped it for a closer look at the small labels and symbols.
Let's try it with the feature ablation table on PDF page 5. Use the document ID from the tool calling tutorial and run the following from the Paper MCP checkout.
pdf-library grid "$DOCUMENT_ID" 5 \
  --output traces/table5-grid.png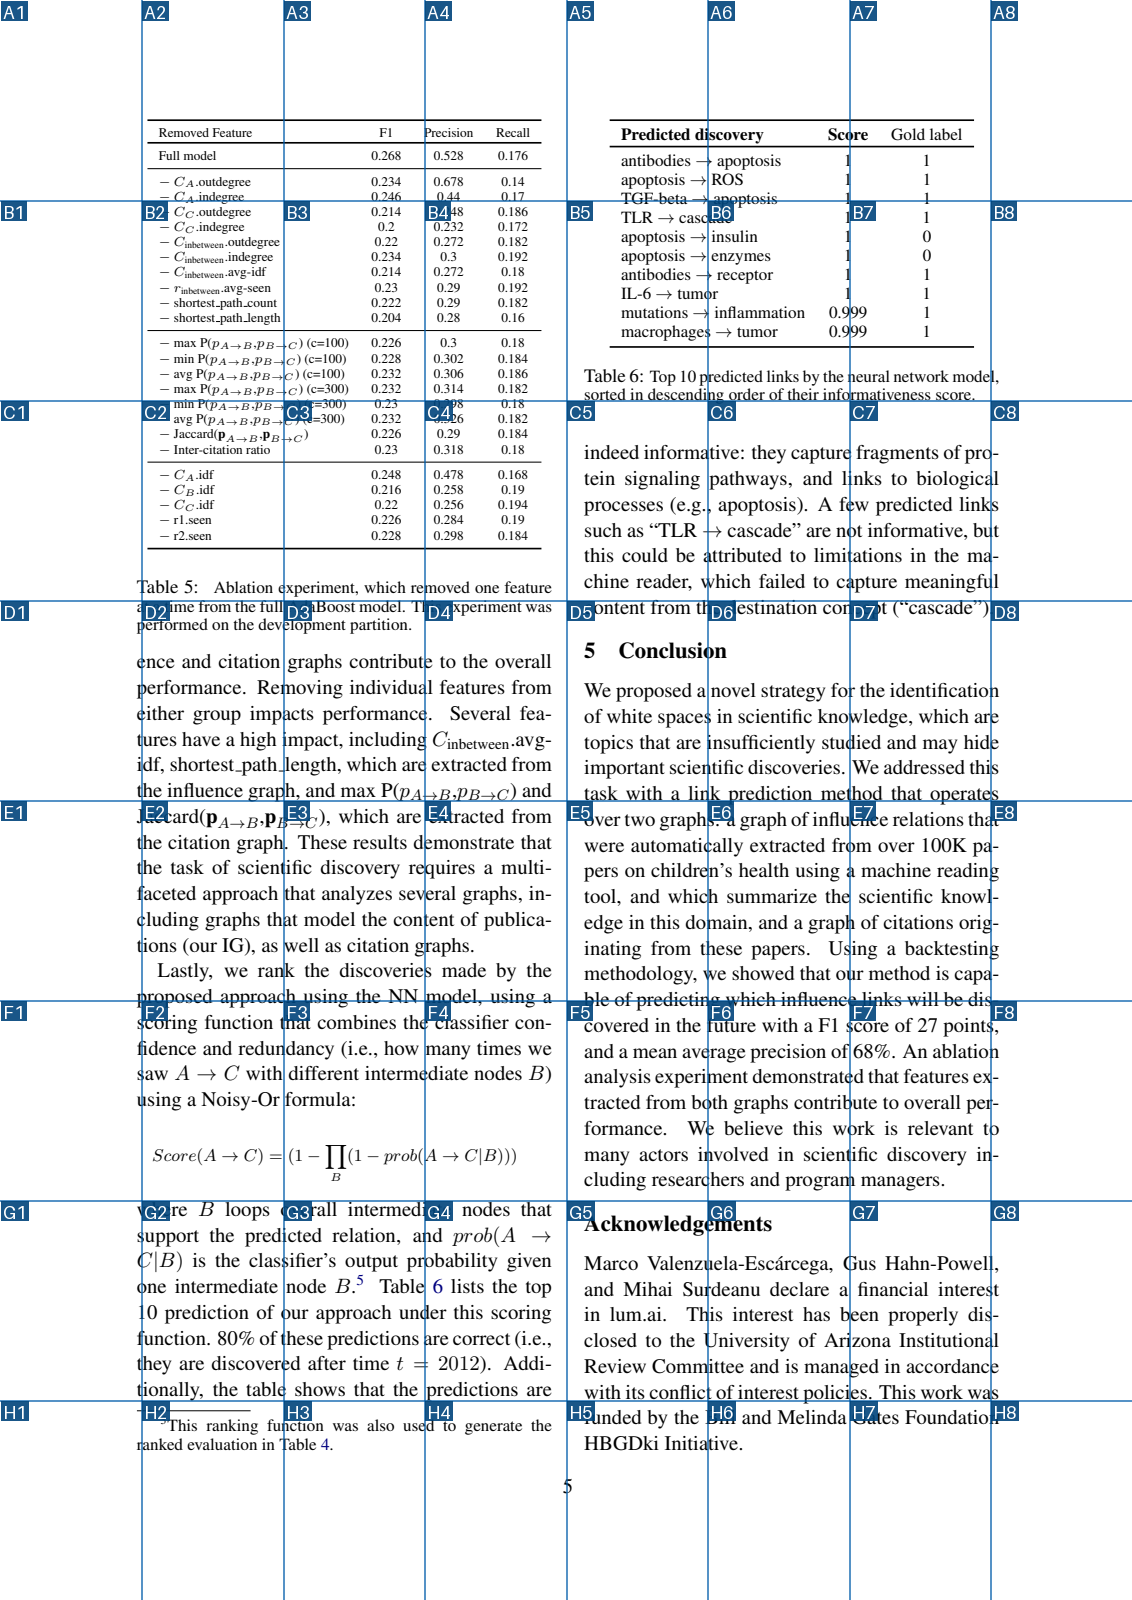
Send the grid image and the question together through the course gateway. In earlier examples, a user message’s content was a string. Here it’s a list with two parts. The text part holds the question, and the image_url part holds the image. Since the PNG is on your computer, the example encodes its bytes as Base64 and puts them in a data: URL. You can use the same message structure to ask a different question about another PNG.
Run this Python example from the Paper MCP checkout after generating traces/table5-grid.png. It uses the same gateway environment variables as the tool calling tutorial. The response_format asks for a list of grid cells for this experiment. You can leave it out when you want a regular text answer about an image.
import base64
import os
from pathlib import Path

from openai import OpenAI

client = OpenAI(
    base_url=os.environ["GATEWAY_BASE_URL"],
    api_key=os.environ["GATEWAY_API_KEY"],
)
image = base64.b64encode(Path("traces/table5-grid.png").read_bytes()).decode("ascii")
question = (
    "Use the drawn 8 by 8 grid over the entire page, including margins. "
    "Rows are A to H from top to bottom. Columns are 1 to 8 from left to right. "
    "Locate Table 5, the feature ablation table with Removed Feature, F1, "
    "Precision, and Recall. Include all headers and rows. Exclude the caption. "
    "Return every grid cell that overlaps the target. "
    'Return only a JSON object of the form {"cells":["A1","A2"]}.'
)
labels = [f"{row}{column}" for row in "ABCDEFGH" for column in range(1, 9)]
reply = client.chat.completions.create(
    model=os.environ["GATEWAY_MODEL"],
    messages=[{
        "role": "user",
        "content": [
            {"type": "text", "text": question},
            {"type": "image_url", "image_url": {"url": f"data:image/png;base64,{image}"}},
        ],
    }],
    response_format={
        "type": "json_schema",
        "json_schema": {
            "name": "grid_selection",
            "strict": True,
            "schema": {
                "type": "object",
                "properties": {
                "cells": {"type": "array", "items": {"type": "string", "enum": labels}},
            },
                "required": ["cells"],
                "additionalProperties": False,
            },
        },
    },
    temperature=0.1,
    max_tokens=512,
)
choice = reply.choices[0]
if choice.finish_reason != "stop":
    raise SystemExit(f"Incomplete response: {choice.finish_reason}")
print(choice.message.content)
In a trial with an 8 × 8 overlay, Gemma selected columns 2 through 5 in rows A through D. The gateway snippet above returned a broader selection in one run (columns 2 through 5 across all eight rows). Inspect the selection before cropping. You can use the saved labels below to reproduce the tighter crop.
pdf-library crop "$DOCUMENT_ID" 5 \
  A2 A3 A4 A5 B2 B3 B4 B5 C2 C3 C4 C5 D2 D3 D4 D5 \
  --output traces/table5-crop.png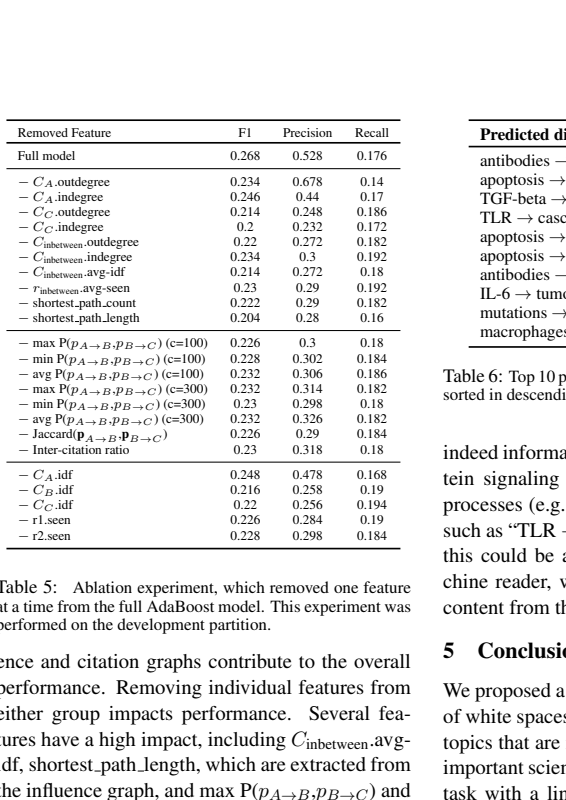
Another way we can enhance a tool is to fold in some form of input validation. Before it crops anything, the crop tool checks that you supplied at least one cell, that the labels are unique and within the grid, and that the cells form one region connected by shared edges. That last check rejects islands, groups of selected cells with no path of shared edges to the rest of the selection. For example, it accepts the L shape A1, A2, and B1. If the model returns just A1 and B2, they touch only at a corner. Try those two labels to see what the crop command prints.
pdf-library crop "$DOCUMENT_ID" 5 A1 B2 --output traces/disconnected.pngusage: pdf-library [-h] {import,list,read,search,resolve,grid,crop} ...
pdf-library: error: Selected cells must form one region connected by shared edgesThe command stops before writing a PNG. A selection such as A2 alone passes validation (no “islands”) and produces a PNG, even though it misses most of Table 5.
The tool crops the smallest rectangle around the selection. For that L shape, the crop also includes B2. Take a look at what came along for the ride in Table 5. The table is readable, and we also got some of the next column.
When would you validate the result? Which checks belong in the tool before it crops the image? What would you check afterward to decide whether the crop is good enough to give the model?
Once you have a crop, use the comparison command to see whether adding the extracted page text changes the answer.
Run the evidence comparison
Use the same Paper MCP installation and gateway environment variables from the tool calling tutorial. From your local clone, run the installed paper-evidence command. It sends two fresh requests with the same question and model, adding evidence on the second request. If you want to see how it works, read the complete example in Paper MCP.
Use the same document ID and Table 5 crop from the grid example. Save the text for page 5 with Paper MCP.
pdf-library read "$DOCUMENT_ID" 5 5 > traces/table5-page.jsonStart with just the crop, then ask the same question with the extracted page text added. In my runs with Gemma 4 12B (gemma4-12b), both conditions yielded 0.528, the correct precision. In a separate comparison, the extracted text alone yielded 0.268, the F1 score.
Think about what changed.
- Why might the crop make it easier for Gemma to match 0.528 to the Precision column than the extracted text did?
- When might adding extracted text help more than using the crop alone? What could that text tell the model that the image leaves out?
paper-evidence \
  --paper 'Scientific Discovery as Link Prediction in Influence and Citation Graphs' \
  --url 'https://aclanthology.org/W18-1701.pdf#page=5' \
  --page 5 \
  --question 'What precision does the Full model row report in Table 5?' \
  --baseline-image traces/table5-crop.png \
  --add-text traces/table5-page.json \
  --output traces/table5-comparison.jsonl
Use a new output filename if you run the comparison again. The JSONL file saves both answers, the evidence used, and the finish reason. Keep the source crop alongside the output if you want to reproduce the request. Check the answers against the paper, including any labels or connections that did not survive extraction.
How the first pass would work with MCP
Use the CLI commands above to run the example. The same first pass can be wired up through Paper MCP in a client.
- Call
render_pdf_gridwith the document ID and PDF page 5. Paper MCP returns a PNG with the labeled grid. - Send that PNG to Gemma as an image and declare
crop_pdf_gridas a function it can request. Give Gemma the document ID and page number in the prompt, and ask it to supply the selected cell labels ascells. - Read the requested function and arguments from the model response. Check the document ID and page number, then call
crop_pdf_gridthrough MCP. Paper MCP validates the selection and returns a clean PNG crop for the client to save or send as image evidence.
Enhance! Can a second grid make the crop tighter?
This worked example starts with the first crop, which includes part of the next column. I put a fresh 8 × 8 grid on that crop and sent it to Gemma with a function called crop_region defined in my Python client. I forced the function with tool_choice={"type": "function", "function": {"name": "crop_region"}}. Its only argument was cells, a list of labels from the new grid.
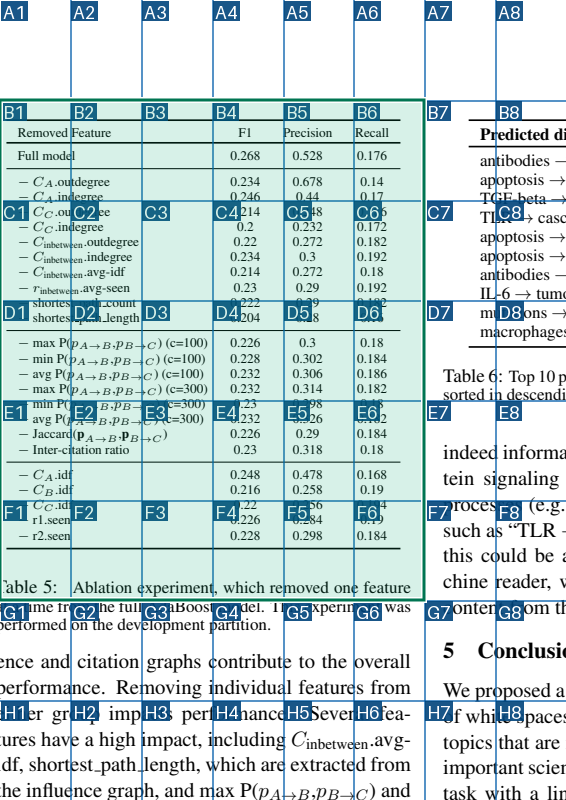
The green rectangle covers the cells Gemma selected in both trials, rows B through F and columns 1 through 6. Those labels refer to the crop it saw. The Python client checked the cell labels, then mapped their boundaries back to the original high resolution page using the first crop’s position and scale. It cropped the rectangle directly from that page image.
The final crop was 53% smaller by area. It kept all the table rows and headers, dropped the neighboring column, and still included the first line of the caption†.
Optional example from another paper
Let’s take a look at Figure 4 of This before That, a paper about determining the causal order of biomolecular events mined from text. Suppose a model is asked which word is marked as the subject of “inhibits” and which entities participate in the binding event. Here’s how I would check its answer.
I’d start with inhibits in the upper diagram. The nsubj arrow links it to binding, which answers the subject question. Then I’d follow the two THEME arrows from the binding event to Ras and PI3KC2beta. The arrow labels tell me which relationship each answer is describing.
PDF extraction can return the words and labels while losing the arrows that connect them. One comparison would be to give the model the extracted text, then add the figure crop. If it still mixes up the subject and the event participants, what would it need next? A short list of labeled links could make those connections explicit.
Optional demo: inspect an image grid
Earlier, we drew a grid to locate the table. When you send the crop, Gemma’s image processor† resizes it and divides it into patches. This demo lets you see how changing the vision token limit changes that grid on the same crop.
Switch between 560 and 1,120 on this crop of Table 5 on PDF page 5. Find a digit or header crossed by a grid line† and see how its placement changes. Each grid cell marks the image region that contributes to one visual embedding in this particular Gemma processor. The blue lines are drawn for us to see. The widget uses measured grids and saved images, so you can use it without a gateway account.
Gemma puts the visual embeddings into a sequence. You can picture it reading out the grid one row at a time. It also keeps position information in two dimensions, so the sequence can still represent which patches are beside or above one another.
Recall our unit on CNNs. A convolution can work over a grid with two dimensions, combining information from nearby pixels or features as a filter moves across the image. That's another way to use spatial structure.
Open the grid comparison on its own.
Try comparing the Precision header and the value 0.528 in the Full model row at both limits. You can turn off the blue lines to compare how the text looks after resizing. This widget shows how the processor prepares the image. To see whether a different limit changes the answer, you would need to run the same question at both limits.
Many hosted APIs accept images and handle preparation on the other side of the request. You may be able to observe that a different crop changes the answer while having little visibility into how the service processed it. With this demo, you can inspect one concrete example of that preparation. Reading a digit and assigning it to the right column are two separate things to check.
Next steps
If your Part 2 question depends on a table or figure, try adding a crop while keeping the question and model the same. Check the answer against the original page. If the model still misses something, what would it need to see to have a better chance of answering?